Figure 1. National Tax revenues structure - 2018
Source: AFIP.
An empirical exploration of geographic heterogeneities in labor markets informality and minimum wage effects
(*)Lucas Ferrero; (**)Matías Hisgen
(*)School of Economics
National University of the Northeast
Resistencia, Chaco, Argentina
lucasferrero@gmail.com
(**)School of Economics
National University of the Northeast
Resistencia, Chaco, Argentina
mhisgen@gmail.com
Reception date: 10/19/2020 – Revision date: 12/31/20 – Approval date: 01/13/2021
DOI: https://doi.org/10.36995/j.visiondefuturo.2021.25.01.005.en
ABSTRACT
Dual labor markets, defined by the existence or not of a formal labor contract, are a widespread feature in developing countries. Part of this duality results from marked asymmetries between relevant groups and categories, given one-size-fits-all regulation. This article proposes an exploration of the relationship between informality and the minimum wage as a potential source of variation for the identification heterogeneous effects between regions in Argentina. The results obtained support the existence of heterogeneities in policy effects between the central and peripheral regions. The distribution of wages and the level of compliance with the associated minimum wage regulations are the main variables of interest; both exhibit differential effects across regions, stronger northern agglomerations. These are robust to various specifications and controls associated with interregional differences (educational levels, size of companies, sectoral differences, among others). Results have important implications given persistent regional backwardness, and heterogeneities in terms of the workings of both markets and related policies.
KEY WORDS: Minimum wage; Informality; Regional heterogeneities; Argentina.
INTRODUCTION
Informality is a widespread phenomenon throughout the world and, with special intensity, in developing countries and Latin America. It sets up constraints and major challenges for economic and social policies. Few years ago, a research agenda on informality has made progress towards its empirical measurement, assessment and the theoretical understanding of causes and implications. But still there is a long way ahead, particularly for Argentina.
Being formal involves costs. For established economic units, these include taxes, compliance with the full range of regulations (related to labor, firm and the environment) and, possibly, exposure to bribery by government officials. Additionally, companies support significant "entry costs", in the form of registration and license fees, in order to operate formally and comply with legal requirements (Djankov et al. 2002). But they also anticipate future “exit costs” either for the business and for the employees, for example, in the form of Employment Protection Legislation (Bentolilla et al, 2019).
Informality also involves significant direct and indirect (private and social) costs1.
Especially in certain activities, it constraints firms’ growth, tend to be associated with low-productivity, (low-return, low-wage) operations; the informal economy reduces productivity, and distorts aggregate figures. It also imposes social costs and externalities in the form of higher tax pressures in the formal sector, dualism and segmentation, among others (see Oviedo, et al 2009).
There are a number of regulations and institutional aspects that may shape informality. One crucial aspect is the tension and incentives they generate when agents choose their formal status. In this paper we focus on the effect of minimum wages. In Argentina, minimum wages are homogeneously set by the national level of government, together with most labor market regulations. These formal regulations and their developments In Argentina are summarized in section 2. Advancing, the minimum wage was established in December 1945 by a decree of President Juan Domingo Perón for the whole country. Later, during the presidency of Arturo Frondizi, the decree was modified and passed as Law 14.459. Today, the Employment Contract Law (20.744), is mandatory and establishes the lowest remuneration that the worker should receive in cash without family charges. It can be modified according to a process described in section 2. Figure 2 displays the evolution of the minimum wage in US dollars and in real terms.
We use the minimum wage to build a threshold and exploit the behavior of the unconditional and conditional wage distributions around it. We use quarterly data of the Permanent Household Survey (Encuesta Permanente de Hogares, in Spanish) over 2004-2019 both to explore associations and for empirical estimation strategies focusing on the issue of labor market informality. The period is heterogeneous in terms of variables than can affect the binding character of the minimum wage constraint. We split the sample four subperiods according to features of the macroeconomic regime that affect the distance between average wages and the minimum wage, including real exchange rate, unemployment and inflationary pressures.
Results support priors regarding associations and relevant sources of heterogeneity. Special attention is given to the geographical differences in the informal share of employment and the main variables of interests (differences in wages, distance to the minimum wage, firm size, human capital, and sector-activity). In our empirical econometric exploration, the dependent variable is informality; a binary variable that takes value one if the workers have no contributory payments to health and pensions systems on behalf of their employers. We estimate different specifications for different time subperiods, using both the whole cross-sectional sample, and regional subsets for the peripheric agglomerations—urban agglomerations in the north regions of Argentina. For the different sample periods, wages and our built-in variable noncompliance (with MW regulations) have a variable effect on the probability of informality. Even after controlling for individual or agglomerate specific and time fixed effects, results are robust.
For the northern regions, both variables, wages and noncompliance, are more importantly associated with informality, with higher absolute point estimates for all specifications. The results vary in their economic importance depending on the macro regime. Firm size, Education and sectoral differences are also robust, also associated with regional differences. The pattern holds with the expected sign, importance and significance for all variables included, with significant expected regional differences.
Finally, we explore an estimation strategy exploiting a restricted sample near the minimum wage. Using point estimations on both sides of the cutoff, it seems that we are actually in the presence of a discontinuity. At the MW, coming from the left the predicted share of informality goes to 0.603, whereas coming from the right 0.298. There seems to be a 30-point jump in the in the informal share. These extends to regional differences with a higher jump in the northern regions. For non-northern regions, coming from the left, the point estimate is 0.603, whereas from the right 0.309, slightly less than the average. For NEANOA, instead, they are 0.607 and 0.265 respectively. We obtain similar results restricting the sample but not based on the distance to the threshold (MW). Using other subsample periods, yield similar (even stronger) results. These suggestive jumps found using regional differences were aligned with our priors. The minimum wage significantly affects the formality-informality decision, and this effect is more stringent in the northern periphery. However, the discontinuity vanishes as we restrict the sample to points closer to the cutoff value (minimum wage normalization). Thus, these results are not robust and the methodology may not be adequate, given doubts on the exogeneity of wages, a key assumption for the strategy.
The empirical strategy and implementation are still subject to scrutiny and improvement. After analyzing these properties, we open a venue for a different estimation: bunching around the minimum wage is found in descriptive analysis, as well as basic correlations with relevant covariates, in cross and conditional moments and in basic regressions. However, data structure imposes limitations.
Our work relates to three main strands of literature: labor policies, geography, and fiscal federalism. The key point is that geography interacts with the federal fiscal regime affecting the patterns of sectoral, scale and technological heterogeneity across different regions. These in turn affect average scales and labor productivities across regions, and therefore the binding characteristic of homogeneous regulations. We use standard categories such as core o peripheric regions (Krugman and Venables, 1990), firm heterogeneity (Melitz 2003), regional redistribution and effects (Persson and Tabellini, 1996, and Obstfeld and Peri, 1998), and other commonly used based on legislation and economics (firm size, tradable-nontradable sectors, and the like).
The literature on informality in general and that applied to labor markets have surged during the last decade. However, our work contributes as an updated application to Argentina, stressing spatial heterogeneities and its sources. The main limitation comes from the data structure in terms of improvements in estimation strategies.
A traditional explanation for informal labor markets, due to Lewis (1954), relies on the notion of segmented labor markets. Some workers cannot have access to regulated, formal markets, and must accept lower-paying and lower-quality jobs in the informal sector. The standard view relies on the idea that the size of the shadow economy is affected by the burden of taxes and social security contributions, as well as by the many other regulations governing the official economy (Galiani and Weinchelbaun, 2012).
Ten years ago, the minimum wage literature had limited evidence concerning developing countries (Lemos 2009). Then, the available literature, mostly based on US evidence, showed that the minimum wage compressed the wage distribution and has a small adverse effect on employment (Brown, 1999; Card and Krueger, 1995). Recently, the adverse effect is understood to affect mainly low-skilled workers. (See Monras, 2019, for a survey with emphasis in spatial heterogeneity and migration.) However, the economics of the minimum wage is different in developing countries, where the minimum wage affects many more workers and labor institutions. Besides, culture, law enforcement and state capacity in general differ in important ways (Monras, 2019).
More recently, a growing literature has taken on the problem of informality and minimum wages for Latin American Countries. Meghir et al (2015), Jales (2018) and Cengiz et al, (2019), all use Brazilian data, which allows for rigorous estimation strategies, to estimate wage distributions for informal and formal jobs. Pérez (2020) has an interesting application to the Colombian case, using inflationary shocks as an identification strategy. Finally, Adam and Buffie (2020) present a dynamic general equilibrium model that tries to reconcile conflicting evidence on the effects of minimum wages in developing countries. They offer an updated summary of the related literature for our research.
The importance of understanding wage heterogeneity and their determinants are key part of learning about the effects of policies on regional development strategies. Most labor related policies are set at the national level in Argentina, even though there are patent regional differences, with persistent backward regions. Understanding the effects of policies may point to a role for provincial and local complementary polices, such as labor hiring incentives, heterogeneous minimum wages and other forms regulations (see Pérez 2020). We hope this paper contributes to that agenda.
The rest of the article is structured as follows. First, we explain the evolution of the main related labor market related policies, including the evolution of minimum wage. Next, we present the conceptual approach and the empirical strategy. Then, we present the main descriptive statistics, graphs and implementation of the empirical strategy (preliminary results). Finally, we present our conclusions.
DEVELOPMENT
Labor legislation, minimum wages and informality in Argentina2
The Argentinean National Constitution determines the tax powers that correspond to the different levels of government. Despite assigning exclusive direct bases to the provinces (separation of sources), and direct tax bases in concurrence with the federal level, the distribution of powers is in fact strongly delegated to the national level.
The historical process behind tax centralization and the federal regime has been long and complex, but national fiscal emergencies played a determining role in episodes of increased tax pressure, de facto delegations, restrictions on the formal powers of the sub-national levels, and subsequent (increasingly rigid) compensations through intergovernmental transfer schemes (Ferrero, 2019, and references therein).
In peripheral regional economies, the weight of intergovernmental transfers is significant. These determine direct and indirect effects of the public sector. Expenditures derived from the intergovernmental transfer components affect the productive structures, markets and activities’ relative returns (Ferrero, 2018). Transfer system pressure inhibits traditional relative price correction mechanisms. The position of relative prices is compatible with differences in sectoral productivity that determine the relative strength of the territory in the dynamics of goods, services and income. In particular, such relative prices are consistent with the compensatory transfer scheme for peripheral economies; reason why they maintain a regional deficit in interregional trade (Obstfeld and Perri, 1999).
Most relevant taxes are regulations are centralized. There have been efforts to recognize relevant sources of heterogeneity such as firm scale, social groups, and activities, with its spatial implications. These efforts are ongoing, and therefore part of a relevant policy agenda. The review of the current state of the regional features tensions with the centralized regime becomes a key element for development strategies. Deficiencies in competitiveness, formality, market accesses, and associated problems (employment, human capital and technology, expulsion, rentier patterns) are part of well reckoned inefficiencies associated with components of the fiscal-regulatory regime.
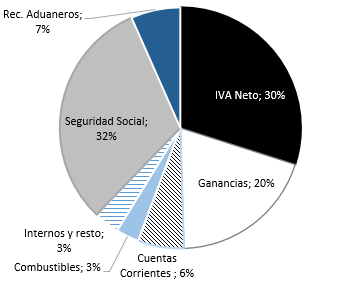
The national taxes in place are 28 in total. They can be grouped into six categories (OECD classification): a) on income, profits and capital gains; b) taxes and contributions to social security; c) on the property; d) on goods and services; and e) on international trade and transactions. The relative participation is illustrated for the year 2018 in figure 1.
Figure 1. National Tax revenues structure - 2018
Source: AFIP.
Taxes and Contributions to Social Security
The national social security regime obliges the employer to withhold from the worker part of the wage bill as a personal contribution to the system. On the other hand, the firm is obliged to make additional contributions labeled as employer contributions. In both cases, the calculation base is the gross salary, although for personal contributions there is a ceiling; the employer contributions have no cap.
The concepts on which employers retain the worker (personal contributions) are: a) Integrated Argentine Social Security System (SIPA, in Spanish), the retirement and pension system, b) National Institute of Social Security for Retirees and Pensioners (INSSJP-PAMI), which is health insurance for retirees and pensioners and c) Health insurance. Employers also contribute to the National Employment Fund (FNE) and to finance the Family Allowances program. Table 1 shows the main structure.
A reform passed in 2017 and has been implemented gradually since 2018 up to 2022.
Table 1. Main labor taxes and Contributions
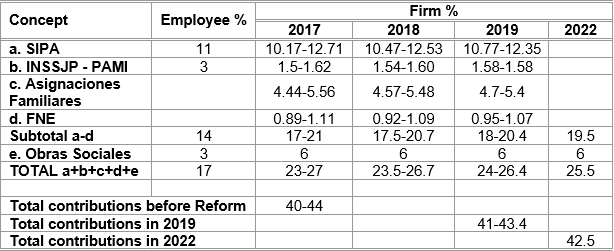
Source: Ministerio de Hacienda (2018) y FIEL 2015
It is relevant to mention that labor taxes have been growing in importance throughout the world. However, Argentina shows a high level in relation to OECD countries and neighboring countries. The total burden of contributions and contributions to Social Security in Argentina is 44%, which is higher than that of Brazil, Paraguay, Uruguay and Chile. Furthermore, few OECD countries exceed the total burden of contributions and contributions from Argentina. Some of them are Belgium, the Netherlands, China and France (Ministerio de Hacienda (2018) and FIEL 2015).
Minimum wages
In Argentina, the minimum wage MW, or SMVM in Spanish (Salario mínimo vital and móvil) was established in December 1945 by a decree of President Juan Domingo Perón for the whole country. Later, during the presidency of Arturo Frondizi, the decree was modified and passed as Law 14.4593.
Today, the Employment Contract Law (20.744), assigns three characteristics to the SMVM (mandatory MW). It is the lowest remuneration that the worker should receive in cash without family charges. It must ensure adequate food, decent housing, education, clothing, health care, transportation, recreation, vacations and pension coverage. And it must be periodically adjusted according to variations in the cost of living. Administrative regulations are established by the National Council for Employment, Productivity and Wages (Minimum, Vital and Mobile Wages) of tripartite composition (government, unions and firm managers) under the Ministry of Labor, Employment and Social Security oversight.
Real Wages and Inflation
Argentina has gone through a process of inflationary pressures, with defined periods. The first around 2004-07, with low inflation. Then, the 2008-11 in the interval [10,20], and [20,30] up to 2015. This subperiod was characterized by increasing price, foreign exchange currencies market controls and increasing relative prices distortions (tariffs and real exchange rates). Real wages and the SMVM curve peaks around 2014 and then go down. During the last subperiod [2016-19], the first two years an (unsustainable) liberalization and stabilization plan took place, and a series of large devaluations followed for the last two years in the sample—available data4.
Productivity and Growth patterns, distortions and overall sustainability varied over the period. That also gives variation regarding the "binding character" of the SMVM constraint.
After the last devaluation, Argentina has one of the lowest minimum wages in the region. The last 35% nominal increase at the end of 2019 had little real effect, since the current minimum wage of 16,875 pesos is equivalent to $ 267 at the official exchange rate.
Unions, collective wage bargaining and the minimum wage
Unions vary in strength in Argentina; as usual, bargaining results apply to formal employment. After the 2001 crises, unions gradually recover strength, extending “collective agreements/bargaining” (according to a law “convenios colectivos de trabajo”), the frequency of wage settings, and so on.
Workers’ General Confederation (Confederación General de Trabajadores, a Union of unions) participates at the Minimum Wage Council. In the last meeting, in August 2019, the CGT demanded that it be set at $ 31,000 in line with the value of the family poverty basket at that time5.
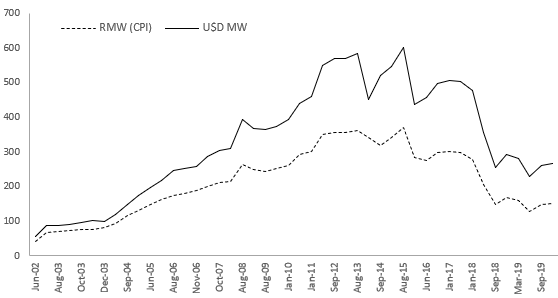
Figure 2. Real minimum wages in Argentina
Source: https://www.argentina.gob.ar/trabajo/consejodelsalario/resoluciones
Geography and structural regional differences
Argentine territory is markedly asymmetric. Income, agglomeration and economic structures differ a substantially between regions. The center region including the provinces of Buenos Aires, Santa Fe, Córdoba, together with Buenos Aires city and the metropolitan area, grasp most of the Argentinean production and population. The Southern Region includes provinces with low population density, higher living costs, and wages. Northern regions (both east and west) are structural laggards, but heavily compensated by (mostly) unconditional intergovernmental transfers.
Other labor frictions
Employment protection and the facto labor costs is the result of formal regimes as well as other institutional factors not encompassed in official legislation. The facto firing costs, courts' and administrative delays in settling labor disputes are among those factors.
Both national and provincial governments have formal and de facto prerogatives. The role of administrative inspections and audits, sometimes in cooperation with unions, adds complexity and the facto uncertainty about firms’ costs structure and productivity. In addition to social security contributions, a few provinces add labor tax rates based on a number of reasons. Regulations are very restrictive for formal employment and firing costs are high. Nonetheless, informal employment may be more costly. Based on indirect proofs of an informal employment relation penalties may be even higher than in formal employment layoffs.
Special regimes and employment incentives
There have been a number of special regimes, typically, oriented to reduce effective tax burdens related to labor employment for small businesses, new firms and geographic areas; none of them affects the MW directly. Some provinces also have this type of employment promotion policies.
Personal, spatial and sectoral implications
Changes in the minimum wage and overall costs of formal employment impact positively in marginal wage costs (and eventually fixed costs). In the case of the MW, the incidence would be higher for groups of firms that concentrate wages around it.
The concentration of wage density near the MW would be more acute for low productivity lower scale firms. In a competitive setup, this implies lower scale or shutdown within the formal market. In a monopolistic competition framework with standard underlying heterogeneity, as in Melitz (2003) and Antras (2012), the change would imply an upward pressure on prices of final goods and/or downward pressures on formal employment. Either channel implies a lower scale of activity. The effect would be more stringent on firms with low-enough scales so as to push them to a binding survival constraint: π = 0→πV = π + f = f, where π stands for profits, π V for variable profits, and f for fixed costs.
Scale therefore should be a determinant of informality in terms of survival. But in a core-periphery model, there are systematic differences in scale, technology (productivity-costs) and sectoral compositions. Thus, the impact of labor regulations on costs, activities, employment, wages and informality, would not be homogeneous.
Figure 3 shows the level of employment and equilibrium wages from the point of view of spatial heterogeneity.
The illustration emphasizes productivity differences between regions, with lower average productivity in the periphery with respect to the center region. (The idea is also applicable to groups of activities or other segmentation criteria.)
Spatial heterogeneity implies that under a common legal and fiscal regime tensions appear. One of them refers to the tension between different equilibrium (mean) wages between regions; this is illustrated in the vertical distance between point A and point B, with lower equilibrium wages in the periphery (Point B) than in the center (Point B). At the same time, within a country there are natural pressures formally homogeneous wages, due to labor market regulations and practices (minimum wages, collective bargaining, firms’ policies in multiple jurisdictions, among others). In this case, the tension appears in the distance between point C (employment in the periphery with salaries from the center) and point B (as a central reference). This tension tends, on the one hand, to reduce the level of formal employment in the periphery, and on the other, to generate informal employment to reduce the marginal burden of the wage gap.
These tensions do not resolve homogeneously, but are affected by sectoral heterogeneity, sizes and socioeconomic variables. On average, we expect more informality, and lower average wages with respect to central jurisdictions in the periphery as average responses to homogeneous regulations. The underlying heterogeneity shapes how regulatory frameworks affect respective markets. This in turn have dynamic selection effect in human capital and sectoral distributions across regions.

Figure 3. Spatial heterogeneity and the labor market
Source: Own elaboration.
Table 2 includes an opening by sector, and the annex by educational level. The variable Salary gap is presented in two subgroups.
The first presents a comparison between categories (formal or informal) between regions. For example, in Commerce, the salary in the NEANOA region for formal employees represents 80% of the salary in the rest of the country; For informal workers, the average NEANOA salary is 80% compared to the rest. Greater wage gap is observed in the informal segment, in commerce, comparing regions. This occurs in all activities with the exception of industry (which in the case of peripheral agglomerations is not relevant (it can be seen that the differences between employment ratios are more important in this area).
Regarding the formal wage gap, it corresponds to the average wage of informal with respect to the formal employees within the same area. Wages are not adjusted by effective hours worked. We correct for that afterwards. Wages in the informal commerce and retail segment represents 48% of the average formal wages in the Rest of the country, and 45% in the NEANOA area (Northeast and northwest of Argentina). This pattern is analogous in all activities, except industry.
Formal employment over total corresponds to the part of total employment registered within the same activity and geographical area. For example, in NEANOA one in two (1/2) of is a formal employment, while in the rest of the country almost two in three (2/3). This relationship holds in all activities. Particularly, the construction sector presents the lowest levels of formality, 40 and 30% respectively for the Rest and NEANOA. These differences may be associated with other underlying differences correlated with regions. For example, human capital, productivity, economic structure, level of unionization / administrative oversight and enforcement, among others.
Table 2. Informality, activities, geography and wage gaps (3q-2018)
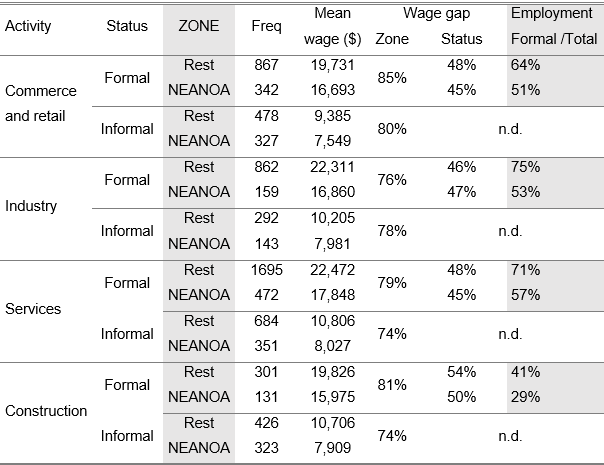
Source: Permanent Household Survey. INDEC Argentina.
In aggregate, relevant wage gaps are observed between regions and the Chaco province, but these are not static, but fluctuate significantly over time according to aggregate political-economic variables. At the sectoral level, similar dynamics are observed, but systematic differences between sectors. The dynamics favor smaller wage gap reductions, and differences in means, in non-tradable sectors, services, construction, rental services, and commerce. This is expected given the urban distribution of the co-participation income pool and its relative weight (discussed in section 2).
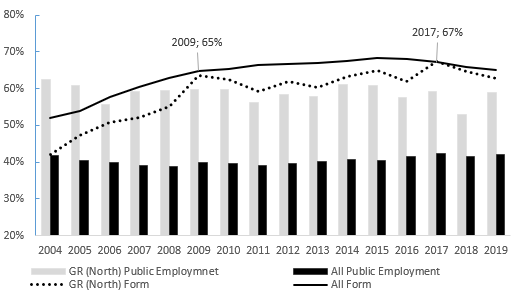
Figure 4. Spatial heterogeneity. Public employment and informality (%)
Source: EPH INDEC.
Methodology and Data
Framework
In the formal sector, the effect of the minimum wage should be at the bottom of the formal wage distribution. We illustrate the approach following Jales (2018) and Cengiz et al, (2019) using Figure 5, which summarizes the effect of the minimum wage on the distribution.
The dashed line shows a hypothetical (frequency) distribution of wages in the absence of the minimum wage (counterfactual in the program evaluation literature). The solid line depicts the actual wage distribution with a minimum wage at MW.
Imperfect compliance is less than perfect. Thus, some workers are paid below the MW, and the post-treatment distribution starts below the minimum wage. (In the empirical illustrations this also holds due to misreporting and measurement errors.)6
The introduction of the MW produces “missing jobs” (Δb), as shown by the striped shaded area (under the dashed line) between the origin and MW. These missing jobs may either reflect workers getting a raise, or their jobs being destroyed, if elusive practices and informality were not possible. Part of Δb creates the “excess jobs above” (Δa), as shown by the solid shaded area (under the solid line) between MW and ![]() .
.
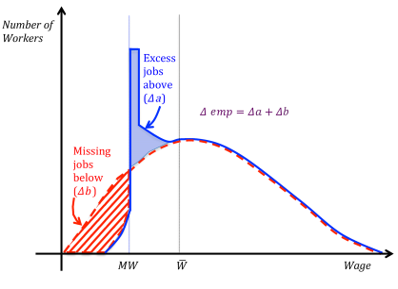
Figure 5. Minimum Wages and the Distribution of Formal Wages
Source: Cengiz, et al (2019)
![]() stands for a hypothetical the upper limit for any spillover effect of the minimum wage on the distribution. Some wages-jobs in the formal sector may be shifted above the minimum wage as part of the spillovers in the theoretical literature; for example, as improvements in the bargaining power of workers, union coordination spillovers or to maintain wage hierarchy within the firm (e.g., Flinn 2011). Moreover, even informal or just-at-minimum wage workers might be induced to participate in job search after the MW. But, these effects of the MW wage are likely to disappear at a certain point, in Figure 5.
stands for a hypothetical the upper limit for any spillover effect of the minimum wage on the distribution. Some wages-jobs in the formal sector may be shifted above the minimum wage as part of the spillovers in the theoretical literature; for example, as improvements in the bargaining power of workers, union coordination spillovers or to maintain wage hierarchy within the firm (e.g., Flinn 2011). Moreover, even informal or just-at-minimum wage workers might be induced to participate in job search after the MW. But, these effects of the MW wage are likely to disappear at a certain point, in Figure 5.
The change in formal employment due to the minimum wage (Δe) is the sum of the two areas (Δa + Δb). However, differing from in developing countries the informal sector absorbs part of the MW effects in the form variations both on informal wage distributions and the relative size of segments: Δi. Thus, denoting ΔE the overall effect on employment,
ΔE = Δe +Δi = Δa +Δb + Δi (1)
Dynamic spillovers
Both positive and negative dynamic spillovers are possible for different modelling setups. For instance, a positive spillover is present if given the MW workers are shift to search more productive jobs that can put up with the wage constraint. On and off the job learning and training add further to human capital accumulation. In these setups, MW may act as coordination devices between multiple equilibria in job-search and technology adoption decisions. In the presence of informality, negative spillovers are possible, as complementarities in markets, may further constraint support services and downstream and upstream markets. Thus, if MW increase the share of labor market informality, persistent negative productivity shocks and scale and/or demand shocks (constraint market access) are likely to show up.
Heterogeneity, effective tax rates and notches analogy
We may also think of the MW as determining a non-linear tax on firms’ employment/wage bill.
Let ![]() be the optimal equilibrium wage for firm
be the optimal equilibrium wage for firm ![]() ; where
; where ![]() is a well define set of group g source of heterogeneity, por example, productivity, market structure, technology-activity, that may display spatial clustering.
is a well define set of group g source of heterogeneity, por example, productivity, market structure, technology-activity, that may display spatial clustering. ![]() is the equilibrium distribution of optimal wages for a given group g of firms.
is the equilibrium distribution of optimal wages for a given group g of firms.
Thus, ![]() determines the share of firms with equilibrium wages below MW in the absence of the legal constraint. For any firm i with
determines the share of firms with equilibrium wages below MW in the absence of the legal constraint. For any firm i with ![]() , we can think of
, we can think of ![]() as a tax to low productivity-wage groups. The effective tax rate therefore follows
as a tax to low productivity-wage groups. The effective tax rate therefore follows
![]()
The ![]() is higher the higher the wedge between the equilibrium and the minimum wages. Then, goes down to zero for
is higher the higher the wedge between the equilibrium and the minimum wages. Then, goes down to zero for ![]() . This creates a peculiar (potentially regressive) kink-notch in the labor tax structure. That is, the implicit tax function
. This creates a peculiar (potentially regressive) kink-notch in the labor tax structure. That is, the implicit tax function
![]()
with I (.) an indicator function. Thus, we may think of formal wages as having an additional effective marginal tax for the subset i: ![]() ; but informal wages don’t. Generally, as in Jales (2017) and others, the literature on labor informality assumes that a share of
; but informal wages don’t. Generally, as in Jales (2017) and others, the literature on labor informality assumes that a share of ![]() moves to informality. Implicitly, this implies imperfect enforcement of formal legal and regulatory frameworks.
moves to informality. Implicitly, this implies imperfect enforcement of formal legal and regulatory frameworks.
Note that this framework is concerned with firms costs rather than workers incomes and income distributions, and labor supply issues. Most empirical studies that use bunching methods on personal income tax schedules, conclude that labor supply elasticities are close to zero (Bastani and Selin 2014).
The foregoing analysis assumes away positive externalities and spillovers for the minimum wage policy both in the supply and demand side, as well as their distributional consequences.
Data and descriptive analysis
We use data from the Permanent Household Survey in Argentina. It is quarterly survey covering 2004q1 up to 2019q4. We append years in subgroups using the criteria explained above. Thus, we have four time-groups: 2004-07; 2008-11; 2012-15; and 2016-19.
The main variables of interest are related to employees in the formal and informal sectors. The variable lwnorm is defined as the difference between the log of monthly wages (for more than 30 hours a week) with respect to the minimum wage in place in the quarter. For the quarters in which the MW changes, we set the benchmark MW for deviations as a weighted average computed according to the months of validity for each one. This is one source of measurement error in our variable. The informal variable is a binary variable defined according to whether the employer complies with social security contributions, in the survey question (either pension and/or health insurance).
Other basic variables include regional categories, number of employees in the same firm proxying for firm size, education years and other proxies for human capital, age, occupation characteristics (according to the National Classification of Occupations), and activity or sector.
Figure 6 shows the frequency distribution of the log deviation of wages from the MW; panel (a) shows the distribution for all regions, panel (b) for the North regions, and (c) for the south.
Bunching around the MW is marked in the aggregate, that includes the center regions and displays a discontinuity to right for the formal sector. For the informal sector, bunching (if any) occurs to the left of the threshold. For the north region, distributions are shifted to the left, and bunching is less neat. The distribution in the southern region is shifted to the right, there is no bunching in the formal sector around MW. Figures for the other subperiods are skiped for space limitations.
Table 3 shows the share of compliance with the MW regulation broken down by region and formality.
Noncompliance is defined as binary variable, that takes value one for wages bellow the MW, for workers in the private sector working more than 30 hours a week (excluding housekeeping services). It may partly be due to measurement errors. NOA and NEA regions, both in the north, share the highest levels of noncompliance for all subperiods. Noncompliance more than doubles in the informal segment. Pampeana and Gran Buenos Aires, both in the center, are leading regions central in policy determination. The southern patagonica region, with higher living costs, displays the lowest levels, in both segments.
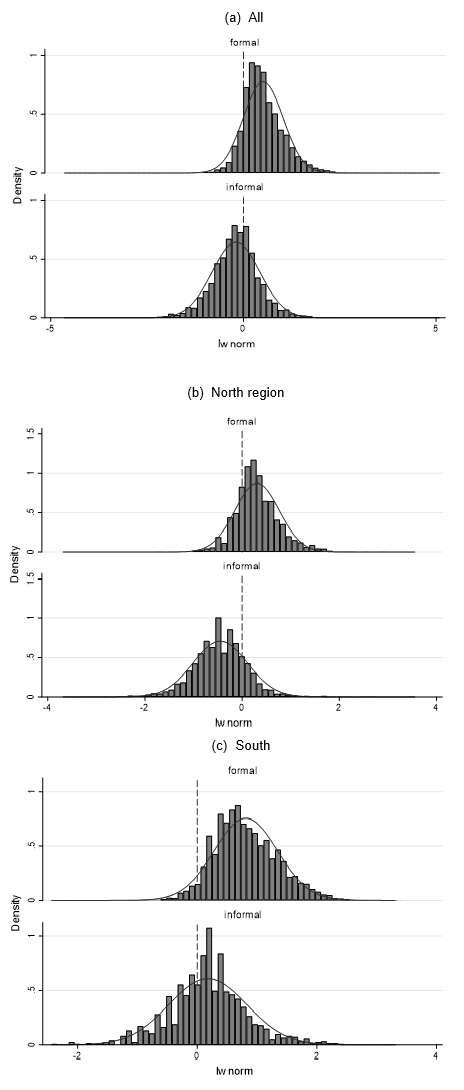
Figure 6. Frequency distribution of formal and informal workers (2004-07)
Source: Permanent Household Survey, INDEC – Argentina.
Note: The variable lwnorm is defined as the difference between the log of wages with respect to the minimum wage in place in the quarter.
For the quarters which the MW changes, we set the benchmark MW by a weighted average computed according to the months of validity of each one.
In the last period, 2016-19, with declining real MW and inflation acceleration, the share of noncompliance is lowest for all regions-segments. So, there are common movements in within variations, but between regions differences persist.
Table 3. Noncompliance with MW by regions and formal status
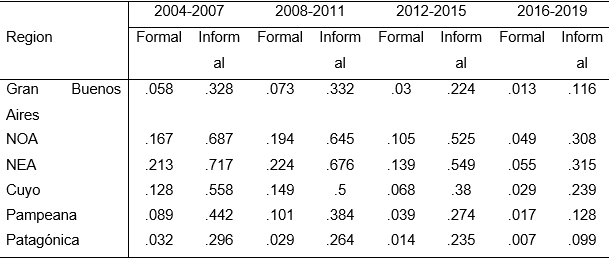
Source: Permanent Household Survey, INDEC - Argentina
Table 4 shows distribution of informality along firm size and two regional categories.
Firm size is defined by the number of employees in the firm as reported in the survey. The analysis breaks down into all regions, and the northern NEA and NOA regions. Informality is more acute in smaller scale firms. In the north, 23% of employees are informal in firms with five employees or less; the same category for all regions corresponds to 18% of employees. Size is also unevenly distributed between regions: 45% of the individuals work in firms with more than 40 employees in all regions, but only forty in the north.
Table 4. Informality and firm size
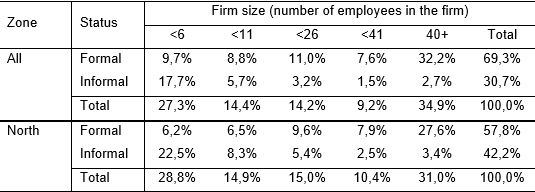
Source: Permanent Household Survey, INDEC - Argentina
Notes: Complementary statistics, not included because space restrictions but are available upon request.
They show that size and noncompliance with the MW cutoff are associated with the share of informal workers.
For example, the share of informality for firms with less than four employees is 86% in Gran Buenos Aires (GBA) with noncompliance whereas it is less than 50% under compliance, with the MW.
For the northern regions, the same figures are 90% and 53%, respectively.
Sectoral differences and human capital
Activities and education levels, work also on expected directions. For example, lower levels of education are associated with lower salaries and worse employment conditions, all associated with structural regional asymmetries. These leads to a source of noncompliance and more informality shares.
Econometric strategy and basic results
Recent years have seen the development of a new empirical approach in economics: the bunching approach. This approach uses bunching around points that feature shifts in incentives to elicit behavioral responses and estimate structural parameters. The approach was initially developed to estimate behavioral responses to taxes and transfers, but is now finding applications in other areas and settings7.
Kinks and notches
The literature distinguishes between two different designs. One is based on kink points—discrete changes in the slope of choice sets—and was developed by Saez (2010) and Chetty et al. (2011). The other type of design is based on notch points—discrete changes in the level of choice sets—and was developed by Kleven and Waseem (2013). In the context of taxes and transfers, the distinction corresponds to whether the discontinuity occurs in the marginal tax rate or in the average tax rate. Kinks and notches offer different empirical advantages and challenges. Although kinks are commonly observed in income redistribution policies (such as graduated income tax systems), notches are ubiquitous across a wide range of other tax and nontax settings.
The idea of bunching estimation is to construct a measure of the excess mass at the kink-notch by comparing the mass of individuals at the threshold point with the mass of individuals at this same earnings level in the absence of a kink. The key methodological challenge is to remove the influence of the kink from the observed income distribution to obtain the ‘counterfactual distribution’.
Saez (2010) uses the actual (observed) income distribution to the left and to the right of the kink to infer the counterfactual distribution locally around the kink (where it is not observed). Chetty et al. (2011) propose a somewhat different procedure where they estimate the counterfactual distribution by fitting a polynomial to the observed income distribution, omitting an income band around the kink. In practice these two approaches often yield similar results. The identifying assumption is that there should be no peak in the counterfactual distribution exactly at the threshold8.
The threshold may be thought of a notch and a kink according to the distribution one is analyzing. For the latent distribution of wages there is a (regressive) kink in as defined in (3). But for other interpretations and, most relevantly, for the wage bill and the formalization decision, there is a notch—a discrete jump in the tax schedule.
Reference points
Notches and kinks may also have and information role. This would be the case if the threshold were a natural focal point for reasons other than the financial incentive (for example, because it is a salient round number) or if the creation of a statutory threshold makes it a focal point per se. Legislation potentially creates reference points in addition to financial incentives. Such reference point effects, amplify bunching and make the observed elasticity overstate the structural price elasticity.
Noncompliance
In the opposite direction to reference points, optimization frictions and imperfect enforcement of policy regulation may act to smooth bunching around the cutoff point. Bunching may occur but partially, and a set of constrained optimal responses due to adjustment costs, information problems, and imperfect enforcement technologies, can apply. So, in our case, we may think of this as the smoothness resulting in both, formal and informal, wage distributions, but also in terms of deviations from expected sharp bunching either in the conditional formal or informal distribution.
Intensive and extensive margin9
Bunching at kinks or notches represents intensive margin responses to price incentives. A difference between kinks and notches is that the latter, by introducing a discrete jump in tax liability, may also create extensive margin responses above the threshold. Such responses will shift up the distribution throughout the upper bracket set, but may also lower employment and participation rates by reducing structural matching opportunities.
Basic estimation
Table 5. Informality estimation results as a binary dependent variable
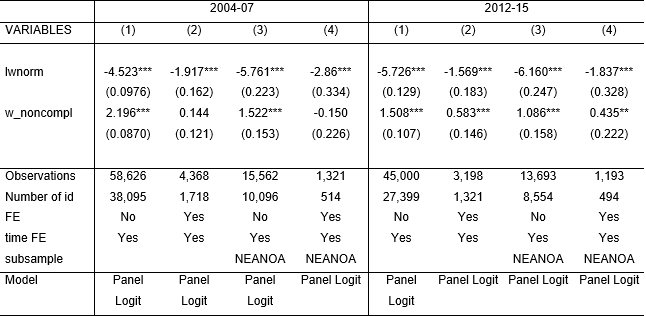
Source: Permanent Household Survey, INDEC - Argentina
Notes. Standard errors in parentheses *** p<0.01, ** p<0.05, * p<0.1 The dependent variable is informality, which takes value of one if the workers have no contributory payments to health and pensions systems.
Regressor lwnorm is the log of wage deviations from the MW. W_noncompl is a binary variable taking value 1 if wages are strictly less than the MW.
Time FE are set by year-quarter according to the EPH (household permanent survey).
NEANOA includes urban agglomerations in the sample on the north regions of the country.
We find that controlling for individual or agglomerate specific fixed effects, within a sample period, reduces the effect of wages on the probability of informality (columns 2 and 4 in Table 5). Occasionally this leads to non-significant inferences. This also holds for the noncompliance component. Since we expect a strong correlation between wage distributions and locations, the result is not surprising—remember that Fixed Effects neat out the mean in all dependent and observed and unobserved covariates.
For the northern regions, both variables, wages and noncompliance, are more importantly associated with informality, with higher absolute point estimates. In the second subperiod shown in the same table, with less slack in the labor market, estimates are stronger in absolute value, and the interregional differences persist robustly.
Size, education and sectoral differences
Tables 6 and 7 present basic extensions to the same estimation methods of informality.
The new covariates include a firm size binary variable, small5, that takes value one if the firm has up to 5 employees. Education is also included as a binary variable: n_educ_he takes value one if basic education is complete; it includes complete secondary education, incomplete and/or incomplete higher education. The variable Industry takes value one if the worker is employed in the industrial sector—according to a two-digit classification code10.
We also present results for the same sample subperiods 2004-07 and 2012-15, one for each table, with the same covariates.
The same pattern holds for the variables above, with the expected sign, importance and significance for all variables included. In the second subperiod with no excess capacity, full employment and distortions in relative prices and general sustainability, results hold robust. Note that even if the level of education is strongly significant, it does not affect our main variables substantially.
Results hold also for other definitions of human capital. The same follows for the variable capturing the firm-size; as we include more employees the importance of the point estimate decays. The variable industry has limitations due to at least two reasons. One is that we are trying to capture the “tradable” concept, as tradable goods can cross borders and therefore are subject to formal controls, whereas nontradable goods are not. The sample is restricted to urban centers and therefore primary activities are excluded. Additionally, the industrial sector may be oriented to the domestic market, avoiding differential controls. This is more likely in the periphery, with smaller firm-scales. Still, the sign is expected and robust.
Table 6. Informality and size, education and industry: Period 2004-07
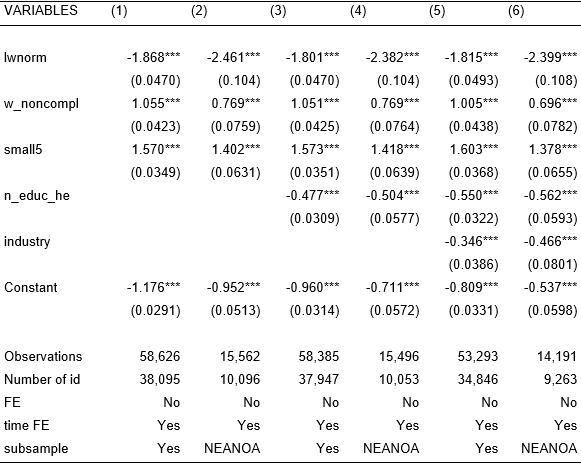
Source: Permanent Household Survey, INDEC - Argentina
Notes. Standard errors in parentheses *** p<0.01, ** p<0.05, * p<0.1 Lwnorm is the log of wage deviations from the MW.
W_noncompl is a binary variable taking value 1 if wages are strictly less than the MW. Time FE are set by year-quarter according to the EPH (household permanent survey).
NEANOA includes urban agglomerations in the sample on the north regions of the country.
Table 7. Informality and size, education and industry: Period 2012-15
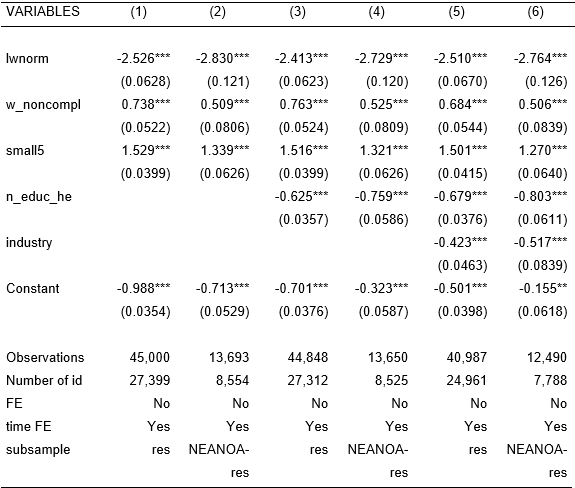
Source: Permanent Household Survey, INDEC - Argentina
Notes. Standard errors in parentheses *** p<0.01, ** p<0.05, * p<0.1 Lwnorm is the log of wage deviations from the MW.
W_noncompl is a binary variable taking value 1 if wages are strictly less than the MW. Time FE are set by year-quarter according to the EPH (household permanent survey).
NEANOA includes urban agglomerations in the sample on the north regions of the country.
We do not present agglomerate fixed effects as results are qualitatively similar to those presented in the more parsimonious specification. Surprisingly, even if point estimates are marginally lower in absolute terms, all are significant at the one percent level, for the different subperiods. Results are available upon request.
Restricted sample
When working sample is restricted near the cutoff lwnorm = 0 (for example, | lwnorm|<0.5) previous models show a smaller and/or non-significant effect of noncompliance, w_noncompl. To illustrates such effect, Figure 7 presents relationship between informality (local relative frequency) and lwnorm, using the whole sample for 2004-2007.
Using point estimations on both sides of the cutoff, it may seem that we are actually in the presence of a discontinuity. At zero, coming from the left the predicted share of informality goes to 0.603, whereas coming from the right 0.298. There seems to be a 30-point jump in the in the informal share. These extends to regional differences in Figure 7.b, with a higher jump in the northern regions.
For non-northern regions, coming from the left, the point estimate is 0.603, whereas from the right 0.309, slightly less than the average. For NEANOA, instead, they are 0.607 and 0.265 respectively. We obtain similar results restricting the sample but not based on the distance to the threshold (MW). Using other subsample periods, yield similar (even stronger) results.
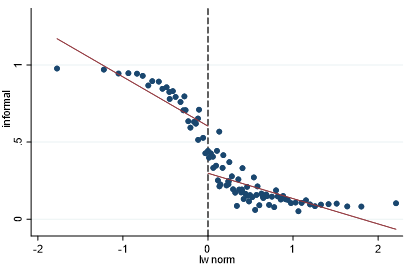
Figure 7. a. Complete support, discontinuity around the MW (2004-7)
Source: Permanent Household Survey, INDEC - Argentina
These suggestive jumps and regional differences are aligned with our priors. The MW significantly affects the formality-informality decision, and this effect is more stringent in the northern periphery. However, the discontinuity vanishes as we restrict the sample to points closer to the cutoff value (MW normalization). This can actually be appreciated in the previous figures. The linear estimation used in computing the jump, does not capture the relation near the cuff suggested by the scatter plot part of each graph. When restricting the support, the jumps shrink gradually. Figures 8.a and 8.b show the results restricting the support to +/-0.5 around the cutoff.
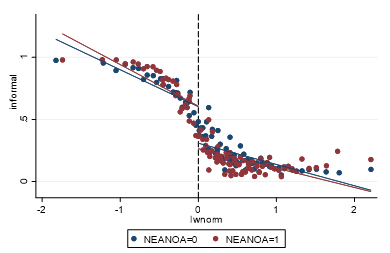
Figure 7. b. Complete support, discontinuity around the MW (2004-7)
Regional differences
Source: Permanent Household Survey, INDEC - Argentina
These results are consistent with previous results regarding noncompliance. There are a number of reasons for these. One that cannot be ruled out is measurement error. The survey may be subject to misreporting, lags, and misperceptions about questions and time. As we already mentioned, there is also the problem of how we construct the reference MW when changes occur within a given quarter. There are other factors that can blur the potential identification, such as optimization frictions and imperfect enforcement of policy regulation, which may act smoothing the jumps around the cutoff point.
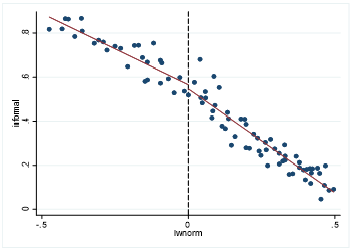
Figure 8.a. Restricted support. No discontinuity around the MW (2012-15)
Source: Permanent Household Survey, INDEC - Argentina

Figure 8.b. Restricted support. No discontinuity around the MW (2012-15)
Regional differences
Source: Permanent Household Survey, INDEC - Argentina
Extensions
An alternative estimation procedure draws on Saez (2010), Chetty et al. (2011), for income taxation, and Cengiz, et al (2019) with a recent application to MW effect in the United States. It proceeds as follows. First, a ‘wide bunching window’ around the kink point is specified and wages are expressed in terms of the absolute distance to the kink point. This window specifies the sample to be used in our estimation of bunching and the counterfactual distribution.
The data is collapsed into bins of width and each bin j is represented by an income level wj defined as the mean absolute income distance between the observations falling within income bin j and the kink or cutoff point. Ideally, this window should be chosen so as to capture exactly those individuals bunching. Bunching is estimated as the number of employees at the kink. Differences in bunching may vary overtime for given changes in MW, leading to changes in the employment and formal status.
The possibility to estimate counterfactual distributions and employment-status effect decompositions can be very useful both to understand effects of MW in presence of relevant sources of heterogeneity, and to improve policy prescriptions and evaluations.
CONCLUSIONS
Informality is a widespread phenomenon throughout the world and, especially, in developing countries and Latin America. Informality also involves significant (social) costs. We explore the stylezed facts and associations regarding informality in Argentina using the Permanent household survey for the 2004-2019 period.
Minimum wages are homogeneously set by the national level of government, together with most markets’ regulation. We use it as a potential parameter that can be exploited both to clarify associations and for empirical estimation strategies. This attribute has important implication if there are persistent relevant heterogeneities, in terms of the workings of both labor markets and policy effects.
Results support priors regarding associations and relevant sources of heterogeneity. Special attention is given to the geographical differences in the informal share of employment and the main variables of interests (differences in wages, distance to the minimum wage, firm size, human capital, and sector-activity). For the northern regions, both variables, wages and noncompliance, are more importantly associated with informality, with higher absolute point estimates for all specifications. The results vary in their economic importance depending on the macro regime. Firm size, Education and sectoral differences are also robust, also associated with regional differences. The pattern holds with the expected sign, importance and significance for all variables included, with significant expected regional differences.
Similar inferences hold for education. For the variable capturing the firm-size; as we include more employees, the importance of the point estimate decays. The variable industry has limitations due to at least two reasons. One is that we are trying to capture the “tradable” concept, as tradable goods can cross borders and therefore are subject to formal controls, whereas nontradable goods are not. The sample is restricted to urban centers and therefore primary activities are excluded. Additionally, the industrial sector may be oriented to the domestic market, avoiding differential controls. This is more likely in the periphery, with smaller firm-scales. Still, the sign is expected and robust.
Overall, results support the hypothesis of variable policy effects across regions. The importance of understanding wage heterogeneity and their determinants are key part of learning about the effects of policies on regional development strategies. Most labor related policies are set at the national level in Argentina, even though there are patent regional differences, with persistent backward regions. Understanding the effects of policies may point to a role for provincial and local complementary polices, such as labor hiring incentives, heterogeneous minimum wages and other forms regulations (see Pérez 2020). We hope this paper contributes to that agenda.
The empirical strategy and implementation are subject to scrutiny and improvement. We open a venue for a different estimation: bunching around the minimum wage is found in descriptive analysis, as well as basic correlations with relevant covariates, in cross and conditional moments and in basic regressions. However, data structure imposes limitations.
NOTAS
1.“Informality” is a term used to describe the collection of firms, workers, and activities that operate outside the legal and regulatory frameworks.
2.This section is based in Ferrero (2019).
3.During Perón’s period, it was then included the short-lived 1949 Constitution, in Part 2 ("Right to fair remuneration"), title I ("Of the worker") and article 37. The Constitution was repealed on April 27, 1956 by a "proclamation" of the military government (dictatorship) headed by Pedro Eugenio Aramburu. The following year (1957), the dictatorship called a constituent assembly, which reduced the concept of the minimum wage, along with some workers' rights, within Article 14 bis of the 1957 Constitution.
4.Perez (2020) studies the effect of an unforeseen inflationary shock on informality through a drop in real MW for Colombia.
5.The discomfort is that, below $ 17,000, the living and moving minimum wage is not enough to cover half of the poverty basket. And it is used as a parameter for teachers and retirees with 30 or more years of contributions. Furthermore, in the case of a typical family (marriage and two children), the minimum wage is far from covering the value of the poverty basket, even if both spouses work
6.In the presence of a binding minimum wage, there should be no jobs below MW. In practice, however, some jobs observed in the data will be sub–minimum wage because of imperfect coverage, imperfect compliance, or measurement error.
7.Kleven (2016) provides a guide to bunching estimation, discusses its strengths and weaknesses, draws links to other literatures, and ponders directions for future research.
8.A regression discontinuity approach may seem appealing as in Jales (2017). However, an important assumption for its validity is violated: sorting around the threshold MW as there exists control of the running variable around it, especially on whether one lands to the left or right of the cutoff. Thus, assignment to treatment in the neighborhood of the threshold is not as good as randomized.
9.Part of the economics literature, in particular, the taxation literature splits the overall level of activity of a number of individuals into two groups: the extensive and the intensive margins. For example, the overall level of work activity of a given population may be divided into the number of individuals that work and the intensity of work supplied by those working. This reflects the distinction between whether to work and how much to work at the individual level and is referred to, respectively, as the extensive (yes or no) and intensive margin (how much to work) of labor supply. At the aggregate level the former is typically measured by the number of individuals in paid employment and the later by the average number of working hours.
10.Codes 10 to 33 for the Clasificación de Actividades Económicas para Encuestas Sociodemográficas (CAES), of the Instituto Nacional de Estadísticas y Censos (INDEC), Argentina.
Please refer to articles in Spanish Bibliography.
BIBLIOGRAPHICAL ABSTRACT
Please refer to articles Spanish Biographical abstract.