Source: Parasuraman, Zeithaml y Berry (1988).
Nominal scale as alternative service quality evaluation: Study case of hacienda Bugambilias Hotel, Mexico
(*)Francisco Javier Urcádiz Cázares1; (**)Mauro Alejandro Monroy Ceseña2
(*)Instituto Tecnológico Nacional de México
Campus La Paz, México
urcadiz@me.com
(**)Universidad Autónoma de Baja California Sur
México
monroym@uabcs.mx
Reception date: 08/23/2021 - Approval date: 09/29/2021
DOI: https://doi.org/10.36995/j.visiondefuturo.2022.26.02.005.en
ABSTRACT
Service quality is commonly measured with instruments that use the Likert scale, which corresponds to a qualitative variable (ordinal or nominal) that in turn is associated with a quantitative one (discrete or continuous). This approximation allows performing operations and comparisons but has generated controversy over statistical management and data interpretation. Nevertheless, an analysis based only on the nominal scale -leaving aside the typical numerical one- may be performed. This study proposes measuring and comparing service quality in a hotel using two different assessment scales: numerical interval and nominal. The perception of hotel service quality was measured during three holiday seasons and contrasted using non-parametric hypothesis tests to observe significant changes when it was valued with a numerical interval and nominal scale. The results show that service quality among holiday seasons contrasts according to the type of stopover. The nominal scale revealed information that the numerical interval could not show, providing some advantages for service quality assessment.
KEYWORDS: Service; quality; hotel; nominal variable; Likert scale
INTRODUCTION
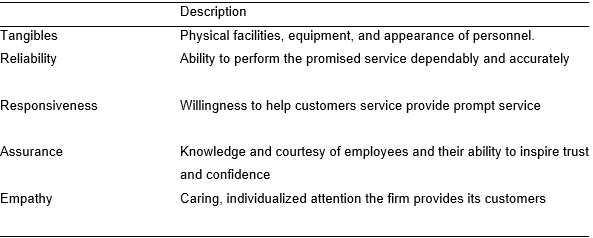
To assess service quality, the literature has documented several methodologies (García and Díaz, 2008; Duque and Diosa, 2014) where the intention is to measure how well it agrees with the level of service perceived by the customer expectations (Zeithaml, Bitner and Gremler, 2013). On the other hand, Kasiri, L. et al (2017) mentioned that evaluating service quality originates mainly in the customer’s opinion, who at the same time informs the enterprise if it is really offering a competitive service with an acceptable quality. Quality constitutes one of the most relevant decision variables for customers to choose among the goods and services in competitive markets. Thus, the reason why it represents at the same time a strategic factor to locate enterprises in a favorable and competitive position (Hsiao, H. and Hsiao, T. 2020). In the case of the hospitality industry, two of the most used instruments are the models SERVQUAL (Parasuraman, Zeithaml and Berry, 1988; Mei, Dean and White, 1999, Akbaba, 2006) and SERVPERF (Cronin and Taylor, 1992; Choi and Chu, 2001; Al Khattab, 2011; Nashwa, 2015; Babić, Arslanagić, Banda and Sivac, 2019), which use components (dimensions) that at the same time conform a construct to be studied (Table 1). Dimensions are measurements in function of the Likert scale where the respondents value according to their perceptions. Data acquisition through Likert scales and the respective analysis are debatable (Carifio and Perla, 2008), given that it is frequently considered as a numeric interval scale, whereas other authors argue its ordinal quality. Therefore, statistical management must be different (Bishop and Herron, 2015).
Table 1. Dimensions of the service quality construct
Source: Parasuraman, Zeithaml y Berry (1988).
Likert scale
The Likert scale consists of a set of items to agree-disagree, question or make judgements about attitudes (Hernández, Fernández and Baptista, 2014). Each item goes with a qualitative scale with an underlying numeric value (numerical interval scale for a continuous or discrete variable) under the assumption that it corresponds to an approximate between quantitative and qualitative expressions (Harpe, 2015). For example, in the progressive sequence: totally disagree, disagree, partially agree/disagree, and totally agree are options to which values from 1 to 5 may be assigned (as numerical interval scale), which is considered by many authors as ordinal qualitative (Javaras, 2004; Göb, McCollin and Remalhoto, 2007). Nevertheless, here is where the controversy exists within the scientific community (Carifio and Perla, 2008; Norman, 2010) if it corresponds to a purely ordinal scale and should be treated with non-parametric techniques or an approximate numeric value that may be treated with parametric statistics (Bishop and Herron, 2015).
The Likert scale design has shown an additional problem many times when the central-neutral category is selected, for example, “neither disagree, nor agree”. Thus, the scale would have two values in the “negative” ordinal sense, one neutral and two in the “positive” ordinal sense. The use of the “neutral” category is highly debatable (Hernández, Begoña and Vicente, 2001), since respondents could choose it for reasons of indifference, ambivalence or not having another elective. Thus, an analysis from the numeric perspective would show bias toward the center. The central-neutral value could cause problems in interpretation when it gets closer to a numerical scale. In this context, many authors have recommended to eliminate this category (Hernández et al., 2001; Zeithaml et al., 2013; Streiner, Norman and Cairney, 2015), leaving only the two extremes of the scale as Duque and Canas (2014) and Zambrano et al. (2015) have implemented.
An alternative for the study and analysis of data based on Likert scales necessarily includes the neutral category (even without it, as long as options are set up as response options), which could be by own techniques for a nominal scale. For example, the contingency table analysis (Anderson, Sweeney, Williams, Camm and Cochran, 2018; Hernández et al., 2014) pays attention only to the resulting frequencies toward an attribute by the respondents. In a nominal scale, it is not necessary to “force” a respondent’s assessment in a numerical scale, nor it implies an order in the sense or direction of the categories, and finally avoids assuming that each category is found in a continuous equidistance. Notably, neither does it require normality assumptions when a numerical scale is used.
In this context, if an instrument as SERVQUAL or SERVP is managed with a nominal scale, what would the result be when data is analyzed under this view? Would the results be consistent with those used by an underlying numerical scale? Which one provides more information for hotel managers? This research deals with the answers to these questions.
Research approach
The Hotel Hacienda Bugambilias (HHB) is an establishment that provides lodging service for 224 persons in 56 rooms in the city of La Paz, Baja California Sur, México. This establishment was selected because the experience of its managers has maintained both service and guest characteristics more or less homogeneous. Previous to this study, the hotel lacked of an evaluation model for service quality. In this context, the setup is “if the service characteristics and conditions of a hotel does not change in the short term (maintaining it more or less similar), then the service quality perception in all its dimensions should maintain constant for the guest population with a determined variability or distribution”. To confront this hypothesis, this research compares service quality perception in HHB in three short-term moments during winter, holy week, and summer vacation seasons (2016-2017).
According to the previous information, the purpose of this research is to (1) determine service quality in HHB through the instrument SERVPERF and (2) compare quality during three vacation seasons by implementing two different non-parametric perspectives. The first one considers a Likert scale with a continuous quantitative type variable (numerical interval scale, as traditionally implemented) and the second one using the nominal qualitative variable scale.
DEVELOPMENT
Methodological research context
According to the conceptual arrangement of Hernández, Fernández, and Baptista (2014), this research corresponds to a quantitative approach (documentary and field) with a non-experimental design and longitudinal tendency. The purpose is to analyze the possible changes (an effect) in a defined period in three quality service perception moments for only one hotel establishment.
Considering that “service quality perception by the guests is maintained equal among seasons both per item and dimension” as null hypothesis, data was analyzed by hypothesis test with non-parametric statistical techniques appropriate for the nominal scale.
Measurement instrument
To measure HHB service quality, SERVPERF (Cronin and Taylor, 1992) was selected, which has been used widely in quality research and consistently adapted to different economic sectors (Duque and Canas, 2014; De Barros, Queiroz, da Silva, da Silva and Calacanti, 2015; Ibarra and Casas, 2014; Torres and Luna, 2017; Monroy and Urcádiz, 2019). The instrument measures the quality concept by means of the respondents’ perceived attitudes in five dimensions (Table 1). Three to four questions (items) are attributed to each dimension. In each original version, the instrument contains 22 items (Parasuraman, Zeithaml and Berry, 1988) with a sectioned Likert scale from 1 to 7 with only two item responses “totally agree” to “totally disagree” in each extreme (without intermediate response options).
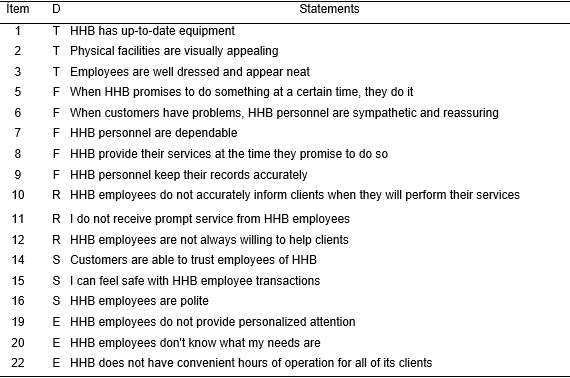
This research used 17 items (Table 2) consistent with SERVPERF, and five were excluded because such questions were modified for a parallel study (Treviño, 2018). Differently from the original SERVPERF instrument, this research adopted two scales: explicitly ordinal and numerical interval (Fig. 1) distributed in five values, such as Mata (2018), Hernández, Fernández and Baptista (2014) recommend. The scale shows two disagreement, one neutral, and two agreement values (as it generally occurs in literature), as well as the value from 1 to 5 taken as approximates of the previous ones. In this manner, the perception was obtained with two scales that allowed the analysis of data from two different perspectives. This study considered the nominal scale because the previously discussed central category was incorporated. It is worth to mention that the Likert scale with a neutral value (intermediate) is recurrently used in social and humanities studies (Mata, 2018). Moreover, questions on some demographic features: sex, age, marital status, nationality, federal entity of origin, and number of nights hosted were added to the instrument.
SERVPERF has demonstrated reliability and validity in several studies, including when adaptations or modifications are performed for different socioeconomic sectors (García and Díaz, 2008; Duque and Diosa, 2014). In this case, the instrument was not modified (only translated to Spanish), which is why a validation or confirmation analysis was not necessary. Nevertheless, because the items were reduced to 17, the instrument reliability was estimated by means of Alfa de Cronbach (Feldt, Woodruff and Salih, 1987) coefficient, which produced a confidence interval of 95% from 0.90 to 0.93 for internal consistency of the items. Thus, the instrument was considered highly reliable (Hernández et al., 2014).
Table 2. SERVPERF instrument with original numbering (Parasumaran, Zeithaml and Berry, 1988). D = dimension, T = tangible elements, F = reliability, R = responsiveness, S = security and E = empathy
Source: authors adaptation.
Data collection and description
The population of study is defined as HHB adult guests in the period from 2016-2017. In average, the hotel hosts 8 355 guests per year (Treviño, 2018) of which, a total of 258 were sampled randomly in three seasons: 70 for winter (December 2016 to January 2017), 81 for Holy Week (Easter week) (April 2017) and 107 for summer (July and August 2017) vacations. The sample represents 3% of the final annual population average. The features of the demographic structure for each season were statistically compared with the software Minitab 17 ®, including the hypothesis test to find differences in proportions and measurements for age, sex, marital status and nights hosted. The previous procedure was performed to establish differences in these features among the three vacation seasons.
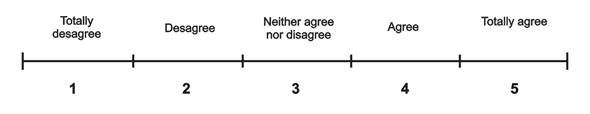
Figure 1. Scale used in the measuring instrument. Above the ordinal scale and below its approximate numeric scale. Because the neutral category "neither agree nor disagree" is incorporated, the scale was handled as nominal.
Source: Authors' own elaboration.
Non-parametric tests among seasons
For the perspective with quantitative variable (where the continuous scale from 1 to 5 is considered) median statistic samplings, kurtosis and bias were obtained with the software Minitab 17 to describe service quality for each item and dimension according to the vacation season. Likewise, a Kruskal-Wallis (Anderson, Sweeney, Williams, Camm and Cochran, 2018) test contrasted the median value among the three vacation seasons (such as factor) for each item, under the null hypothesis that the average value (median) is equal among seasons with a level of significance of p > 0.01. This test was selected because data did not satisfy the normality assumptions for an analysis of variance (ANOVA) of one parametric statistic factor. To compare the dimensions per season (factor), all data of the items were joined according to dimension, performing the previously mentioned test, for example, item 1+ item 2 + item 3 = dimension of tangible elements.
For the perspective with qualitative variable (nominal), bar charts and homogeneity hypothesis were performed for contingency tables (Anderson, Sweeney, Williams, Camm and Cochran, 2018) by means of Pearson’s distribution with the statistical test:
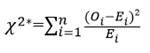
Where Oi corresponds to the observed frequencies for k number of categories (in this case k = 5 categories, from totally disagree to totally agree, Fig.1) and Ei to the expected homogeneity frequencies, considering as controlled variable the vacation season. The level of significance used was p > 0.01, which is 99% of confidence level. This procedure tests if the categorical frequencies for each one of the items is the same among the three vacation seasons (null hypothesis). Finally, to compare the dimensions among the three seasons, the same test was used but considering the total sum of the frequencies obtained for each item according to the dimension. In this manner, the sum of the frequencies represents the observed value. The previous setup tests if the distribution of the sums of the values per dimension is the same among seasons.
RESULTS AND DISCUSSION
The demographic characteristics of the guests visiting HHB during winter, Holy Week and summer vacation seasons were similar according to the statistics obtained (Table 3). Age mean, sex ratio, and nationality did not show significant differences in a level of confidence of p > 0.01. Despite the guests were surveyed in different seasons, data suggest they maintained homogeneous characteristics. Other demographic structure features not considered in the survey were for example, beliefs, religion, emotions, among others that could have an effect on service perception. Nonetheless, the randomized procedure and sample size were sufficient for an acceptable representation of the statistic population in study.
Service quality measured with the interval scale (quantitative variable)
The perceived HHB service quality per item show low variability on average (arithmetic mean) same as dispersion (deviation standard) when compared longitudinally among the vacation seasons (Appendix 1). Asymmetry measures indicated a wide variability and moderate to strong asymmetry and kurtosis among seasons. The highest average value was 4.3 for item 9 on the effort to maintain a record without errors in reliability. On the other hand, the lowest average value was 3.38 for item 16, which corresponds to the courtesy on the part of the employees in the security dimension. The assessment performed by the guests at the level of item offered valuable information to identify weaknesses and strengths of the hotel service according to the scale, above all, it could potentially help in organizational improvements and decision-making in function of an average numeric indicator.
Table 3. Guest general characteristics. ![]() = mean, s = standard deviation, p = proportion. *p value > 0.01 of difference means and proportions test.
= mean, s = standard deviation, p = proportion. *p value > 0.01 of difference means and proportions test.
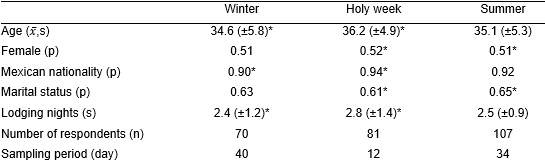
Source: Authors' own elaboration.
Table 4. Kruskal-Wallis tests by items. D = dimension, H = test statistic, DF = degrees of freedom
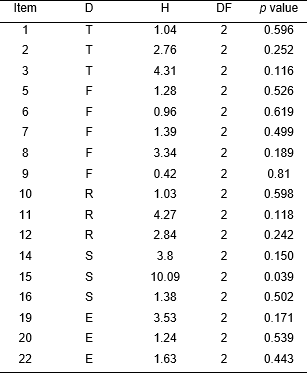
Source: Authors' own elaboration.
Despite the average value showed variability for individual item measurements among seasons, Kruskal-Wallis hypothesis test (Table 4) indicated that no significant difference existed among the median values in the three seasons under a confidence level of 99%. These results show that statistic evidence is not sufficient to support that average values are different among vacation seasons if an independent analysis per item is considered.
On the other hand, the perceived quality by dimension (Table 5) showed similar values among seasons. The lowest and highest average values were obtained in winter with 3.74 for the hotel tangible elements and 4.13 for responsiveness. According to Kruskal-Wallis hypothesis test by dimension (Table 6), no significant difference was found among the values of the three season medians with a confidence level of 99%.
Table 5. Service quality statistics by dimension. ![]() = mean, s = standard deviation, p = proportion
= mean, s = standard deviation, p = proportion
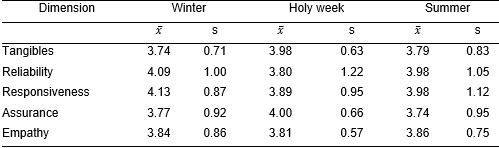
Source: Authors' own elaboration.
The results indicate that service quality perception was valued equally in the three vacation seasons. The hypothesis test of both items and dimensions supports the assumption that “by not changing the service characteristics and conditions of a hotel, neither would the average service quality perception change”.
Evidently, perception is a construct that evolves according to social and cultural characteristics of the population. Thus, it is susceptible to change in a prolonged period of time, maybe medium or long term. Nevertheless, the time assigned in this study was short enough to avoid influence due to a sociocultural change.
Table 6. Kruskal-Wallis tests by dimension. D = dimension, H = test statistic, DF = degrees of freedom
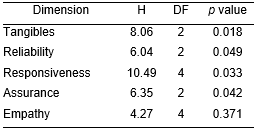
Source: Authors' own elaboration.
Service quality measurement with nominal scale (qualitative variable)
From this perspective, HHB service quality assessment per item is shown by frequency distribution in Appendix 2. In general terms, distribution remained similar when compared among the three vacation seasons. For example, for item 2 on perception “the facilities are appealing to the eye”, the guests leaned with greater frequency to “agree” in 57, 57 and 55% in winter, Holy Week and summer, respectively. The second most frequent option was “neither disagree, nor agree” with 27, 26 and 24% in the same seasonal order. Subsequently, frequencies were maintained similar in the majority of the items, which indicates that the vacation season is a factor to attribute change in perception according to the category distribution.
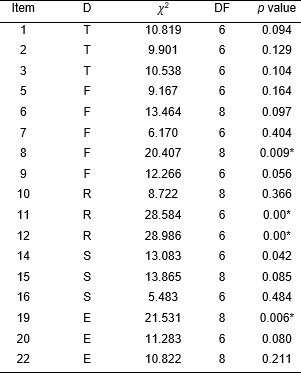
However, the homogeneity test for each item (Table 7) indicated that no significant difference was found among seasons in 13 of 17 items. The exceptions were item 8 of the reliability dimension, 11 and 12 of responsiveness, and 19 empathy, which showed a difference in frequency distribution at least in one vacation season. For example, in the case of item 11 “I do not get prompt service from HHB employees” in Holy Week 42% maintained “neither disagree, nor agree”, whereas for winter 21% considered this option. Additionally, in Holy Week 26% “totally agree” while in summer 38% considered this option. It is worth to highlight that in summer 12% expressed “not agree” with the item, whereas in Holy Week and winter only one person leaned to not being in agreement. These changes in percentage of the perceived quality toward nominal attributes both from item 11 and the rest of the cases where the null hypothesis was rejected, favor a significant difference around seasonal distribution.
Table 7. Homogeneity tests for contingency tables by items. Rejection of the null hypothesis *. D = dimension, ![]() 2 = test statistic, DF = degrees of freedom
2 = test statistic, DF = degrees of freedom
Source: Authors' own elaboration.
In the analysis by dimension, during the three seasons, empathy consistently recorded major frequency where 68, 69, and 69% of the guests selected “agree”. Given that the option “agree” and “totally agree” corresponds to the same positive sense and excludes the other attributes, a robust indicator of the quality perceived is obtained by joining the percentages. This result shows a moderate lineal correlation (r = 0.724, Fig. 2) with the indicator in the measurement considered with continuous numerical scale. This relationship is the way of visualizing how both indicators converge.
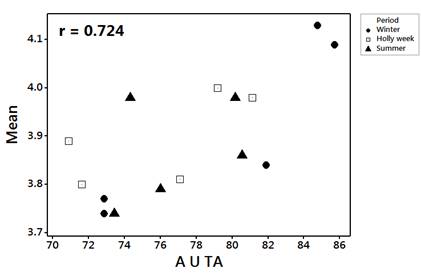
Figure 2. Pearson's linear correlation of the union of the nominal categories “agree” with “totally agree” (AUTA, in percent) with the arithmetic mean of the continuous scale.
Source: Authors' own elaboration.
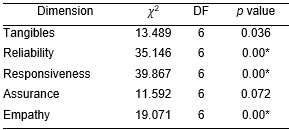
Nonetheless, with respect to frequency distribution by dimension, the homogeneity tests (Table 8) indicate that three out of five dimensions show sufficient statistical evidence to support that the distributions are different. The response capacity and empathy of the reliability dimension shows a value of p <0.01. The elements of the tangible and safety dimensions did not show differences, which is why in these last ones the guests valued the attributes of the three vacation seasons similarly.
From this perspective, the tests among seasons at item and dimension levels cannot support the hypothesis set out conclusively when the frequency distribution of the nominal attributes is considered.
Perspective (quantitative vs qualitative variables) comparison
The results of both perspectives contrast according to the respective tests when quality in the different vacation seasons was compared. Although service quality indicators potentially useful for HBB decision-making and organizational improvement were obtained in both perspectives, the nominal qualitative perspective revealed information that the quantitative one did not statistically evidenced.
Table 8. Homogeneity hypothesis tests by dimension. Rejection of the null hypothesis *. D = dimension, ![]() 2 = test statistic, DF = degrees of freedom
2 = test statistic, DF = degrees of freedom
Source: Authors' own elaboration.
From the quantitative perspective about average (median), service quality per item and dimension show they are not significantly different among the three seasons. This result can be interpreted that the average HBB service quality was maintained constant during the three seasons, considering that the sample captured the population of study representatively under the randomized exercise implemented. In the same item, guest characteristics were maintained similar, which suggest, in general terms that the vacation groups with similar and close proportions in age, sex, and nationality have an equal average perception starting from the quantitative scale.
On the other hand, from the qualitative perspective, frequency distribution of the nominal values in four of 17 items and three to five dimensions were different among the seasons. The items 8, 11, 12 and 19 stood out with a p < 0.01 value that corresponded to the dimensions that were significantly different among seasons. Therefore, this perspective is also consistent among items and dimensions, which indicates that a different assessment for an item under the nominal scale is sufficiently sensitive to influence in the rejection of the null hypothesis of the corresponding dimension, at least in this case study.
The qualitative perspective detected information that the quantitative one did not reveal. For example, in the case of item 11 on “I do not get a prompt service from HHB employees” the averages for the seasons were 4.1, 3.8 and 3.9, respectively, indicating similar values. These data contrast with the percentage of the respondents that “neither disagreed, nor agreed” with 22, 42 and 20% respectively, where 42% support a neutral position without leaning to a positive or negative sense with such setup. Therefore, assessments in the nominal scale may be different and the quantitative assessment could be equal or similar (no significant difference). An explanation of this discrepancy is that different frequency distribution scenarios for a qualitative variable could produce the same quantitative information in average. Fig. 3 generalizes three hypothetical scenarios where the mean and median are similar but the nominal distribution is different, which denotes information that is not possible to observe when averages are used as indicators.
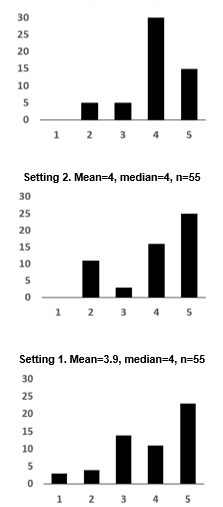
Figure 3. Comparison of hypothetical settings. If the variable is considered as quantitative (interval scale from 1 to 5), the indicators such as the mean and median remain similar, but it is considered as a nominal variable, the frequency distribution of the bar graph is totally different. The scale from the nominal perspective is: 1 = Totally disagree, 2 = Agree, 3 = Neither agree, nor disagree, 4 = Agree, 5 = Totally agree.
Source: Authors' own elaboration.
To sum up, both perspectives are useful data analysis tools for instruments based on perceptions with the Likert scale. Nonetheless, the nominal quanlitative analysis based on multinomial frequency distribution shows additional information to that of the traditional (continuous numeric) analysis with the advantage of not having to assume that the numerical scale is an approximate to that of the ordinal Likert scale. Another advantage is that it avoids the problem of the neutral value discussed by Hernández (2001) because the order of the categories is not important in the nominal scale. From a practical optical view, managers and decision-makers could center in the percentage of the respondents that “agree” or “totally agree” (or both) for a dimension or item in particular during quality monitoring from short to medium term instead of only monitoring an average. This analysis perspective could be used supplementary to the traditional one, as long as the scale is nominal or ordinal and expresses the categories of the neutral value in the respective surveys. The technique is useful for any instrument that uses the nominal scale not only for the hospitality industry but also any economic sector.
On the other hand, one of the limitations of this study was that data were manipulated or transformed, that is, they were not normalized so that both perspectives were tested non-parametrically. The guests were surveyed with questions limited to sociocultural conditions – age, sex, marital status, number of nights, and nationality. Other conditions, such as beliefs, emotions, religion, among others, could have had a not foreseen effect in the research.
This study used the double scale with the purpose of comparing two non-parametric methodological perspectives, revealing the potential use of nominal scales in assessment. Clearly, the systematic use of the two scales at the same time for assessment studies of service quality is not recommended. Otherwise, under the quantitative perspective using scales with signs in the two extremes -without intermediate tags- only with consecutive numbers is recommended to approximate to a quantitative variable. On the other hand, if the scale is considered ordinal qualitative, only should the categories be left in order without numerical tags using the statistical techniques shown by Javaras (2004) and Göb, McCollin and Remalhoto (2007). Lastly, in the case that a study requires using a scale with neutral category, the use of the nominal scale is recommend without numbers using the techniques discussed in this study. A type of perspective (variable) should be defined and the respondents sensitized on the scale and its value options.
CONCLUSIONS
This longitudinal research work determined the type of service quality perceived by the HHB guest by means of the instrument SERVPERF in three vacation seasons. Two different perspectives were used, one where the Likert scale is considered as quantitative continuous (as traditionally managed in literature) and the other one taking the scale as nominal, innovating the use of the non-parametric techniques as an alternative for service description and quality analyses, in this case for the hospitality industry but with application to any industry or economic sector. When data behavior was compared in the three seasons, the quantitative perspective suggested no significant difference in the quality perceived in average (median) by the guests. The previous is both at item and dimensional levels. These data support the setup hypothesis that “if the service condition and characteristics in a hotel do not change in the short term, then service quality perception in all its dimensions should maintain constant for the population of study”. In contrast, from the qualitative perspective (with the nominal scale), if the frequency distribution of the categories shows a significant difference in reliability, response capacity and empathy dimensions in at least one season, the setup hypothesis is partially rejected from this approach.
More than rejecting or not the research hypothesis, the data analysis –considering the nominal scale – revealed information that the traditional numerical scale did not record. Thus, the averages (mean or median) of service quality - from the numeric perspective for a given dimension – may maintain constant in the short term. However, frequency distributions of the category may be significantly different as evidenced in this study. The nominal scale shows advantages over the traditional one, above all in that it neither assumes a continuous numeric approximate nor implies an order in the categories, nor a normality assumption, which is why it is a potentially viable alternative for service quality assessment when the use of a “neutral” category is required, including for other particular selections.
NOTES
1.Profesor - investigador de asignatura adscrito al Tecnológico Nacional de México, en el Instituto Tecnológico de La Paz, Departamento de Ciencias Básicas. Doctorado en Ciencias Marinas en el Instituto Politécnico Nacional. Sus líneas de investigación aplicadas a la empresa son el diseño y análisis estadístico multidisciplinario. ORCID ID: 0000-0001-8072-8162 urcadiz@me.com.
2.Profesor – Investigador de la Universidad Autónoma de Baja California Sur adscrito al Departamento Académico de Economía. Doctor en Ciencias Administrativas en el Instituto Universitario de Puebla. Cuenta con investigaciones publicadas en las áreas de conocimientos de: Calidad de servicio, satisfacción del cliente, lealtad y mercadotecnia aplicada. ORCID ID: https://orcid.org/0000-0001-7175-9362. monroym@uabcs.mx.
APPENDIX
Appendix 1. Service quality statistics by item. As = coefficient of skewness, Cu = kurtosis
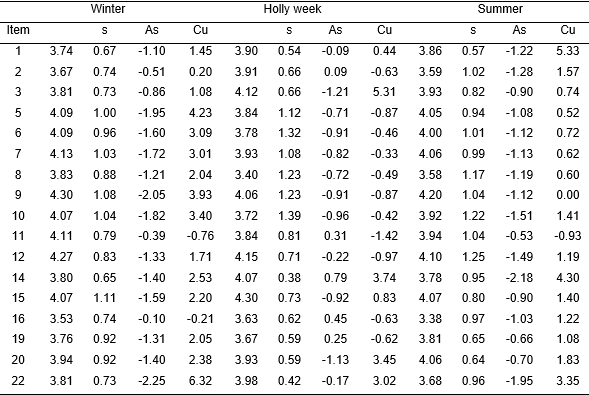
Source: Authors' own elaboration.
Appendix 2. Frequency distribution (by item and dimension) considering the variable as qualitative nominal. TD = Totally disagree, D = Disagree, NDA = Neither agree nor disagree, A = Agree, TA = Totally agree.
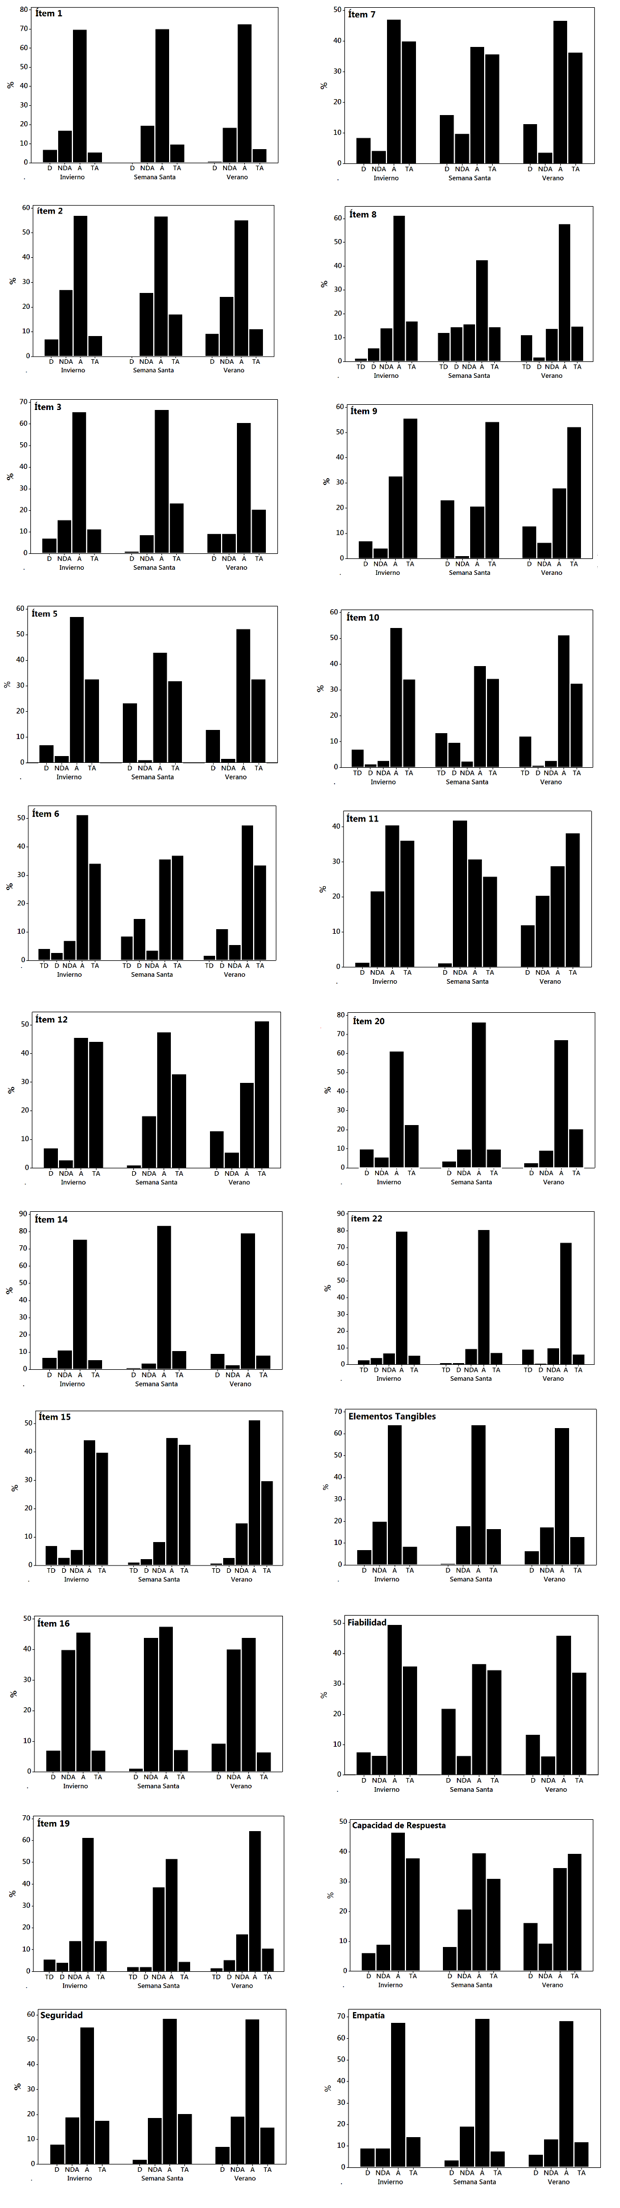
Source: Authors' own elaboration.
REFERENCES
Please refer to articles in Spanish Bibliography.
BIBLIOGRAPHICAL ABSTRACT
Please refer to articles Spanish Biographical abstract.